Notes about Model Time Steps
Prepared by Keith Aric Cherkauer
Model time steps are an important consideration when setting up and calibrating the VIC macroscale model. Increasing the time step reduces the amount of time needed to run the simulation, but it also reduces the accuracy of the representation of sub-daily processes. Test simulations were conducted using the 4 year calibration period of 1980-1984 on the Iowa River which consists of 15 1/2 degree grid cells. Table 1 compares the run time for several different time steps, and model options. All simulations were run on scope.hydro, a 400 MHz Pentium II system running LINUX. The fastest solution is obtained from the daily water balance model. While the hourly water balance model and the 3 hourly energy balance model were comparable.
Table 1: Comparison of the run times for various model time steps. User time is the total time needed to run the program, while system time is the total time needed on the CPU (does not include file I/O, etc.).
| Model Simulation | User Time (min) | System Time (s) | Approximate Time per Cell per Year (s) |
|---|---|---|---|
| Hourly Energy and Water Balance | 8.8 | 3.87 | 8.8 |
| 3 Hourly Energy and Water Balance | 3.2 | 2.34 | 3.2 |
| Hourly Water Balance | 2.9 | 3.21 | 2.9 |
| Daily Water Balance | 0.7 | 1.04 | 0.7 |
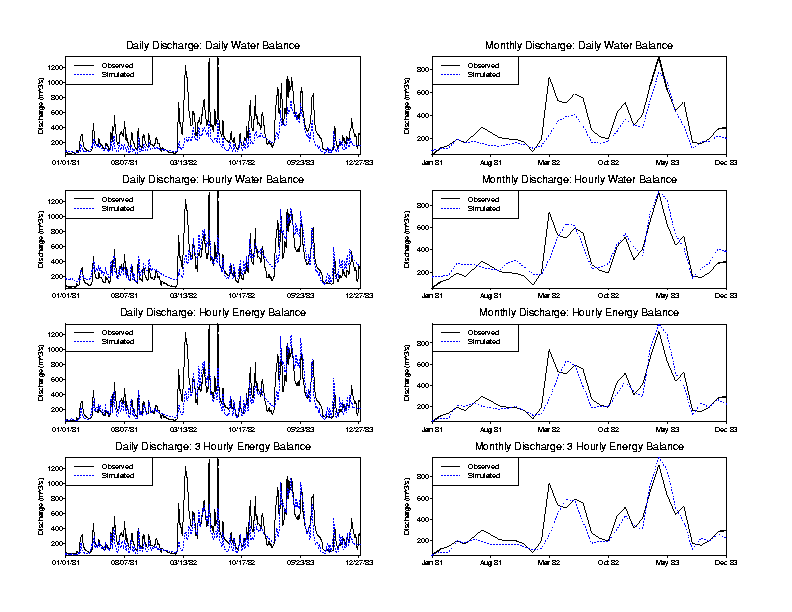
Differences in simulated daily and monthly discharge as caused by changing the time step, and using the different model options are shown in Figure 1. It should be noted that the simulated peaks show the greatest sensitivity to model time step. Courser time steps yield fewer peaks. VIC was optimized for the basin using the hourly energy balance model, the optimized parameters were then applied to all cases.

Figure 1: Comparison of daily discharge for various model options and time steps. (Top) Daily water balance, (Upper Middle) Hourly water balance, (Lower Middle) Hourly full energy balance, and (Bottom) Three hour energy balance.